One of the very first things I teach in my spreadsheets course is how to structure data properly. In order to take advantage of the power of spreadsheet functions and to do any basic analysis, the underlying data needs to be organised in the right way, and unfortunately, this is not always so intuitive to the average user. Once learned, however, it is very simple to do in practice.
What usually happens
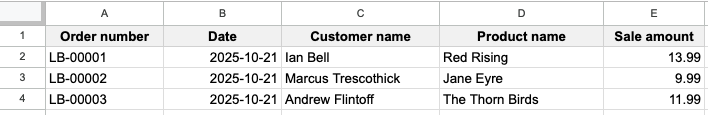
Let’s use an example of a bookstore called Lighthouse Books. Fred, the owner, wants to record information about each book sale that he makes: who bought it, what they bought, what he charged, and so on. So, being a normal business owner who knows his way around a computer, Fred fires up a new spreadsheet and adds in some column headings: order number, date, customer name, product name, and sale amount (we’re keeping things simple for now).

By 9:30am, Fred has already made three sales, so he enters the data as follows.1
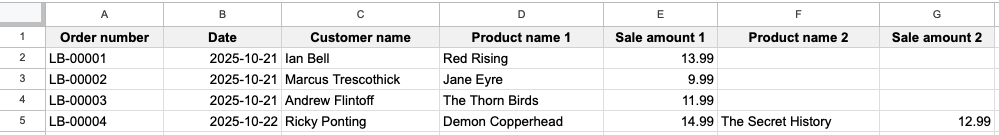
There are a couple interesting patterns to note about these book sales (any cricket fans here?), one of which is that each customer only purchased one book. What happens, however, when someone wants to buy two books? Fred’s first thought is to add two new columns like so.
But this only “solves” the problem if someone wants to buy two books. What about three? Or six? Is Fred going to start adding new columns for product name and sale amount for every possible number of books someone could buy? Definitely not. As soon as you start to notice an open-ended, list-like nature to some part of your data, this should trigger an alarm bell.
Here's why adding more columns doesn’t work. Say Fred wants to add up his sales. You probably know about the SUM function, but which column should he sum? In the image above, it’s columns E and G. But if Fred has added more columns to allow for the purchase of multiple books, then he will also need to sum columns I, K, M, and so on (every second column). This is an extremely tedious process, but more importantly, there’s no limit to the number of books a customer might buy, so is Fred just going to keep adding more and more columns, needing to constantly edit his SUM function?
Or let’s say Fred wants to know how many of each book was sold for inventory purposes. He would have to combine the product name columns somehow, leading to the same open-ended issues. So we can see that more columns isn’t the way.
Tidy data
The answer to this is tidy data, an approach formalised by statistician Hadley Wickham. This comprises three simple rules:
- Every event gets its own row
- Every piece of information about an event gets its own column
- Every type of thing we want to observe gets its own table
Fred unknowingly followed the first two rules by putting each sale in its own row and then having columns for the different pieces of information about the sale. But it’s in the third rule that he went wrong. If we were to name Fred’s table, we would probably call it orders, since each row represents an order by a single customer. And this table structure works if Fred wants to observe order-level information, like the amount of orders made per day, but here he is trying to calculate more detailed information — the book names and prices within each order. So what Fred really needs is a table of order line items. Let’s see how that would look.
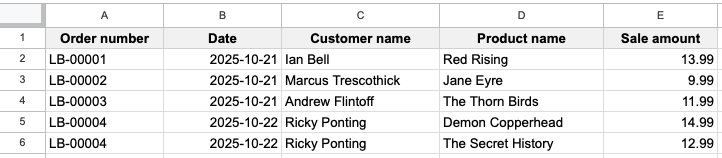
The values in columns A, B, and C have been copied from row 5 into the new row 6, and the second book purchased by Ricky Ponting has been put into the original product name and sale amount columns. Plus we’ve deleted the second set of product name and sale amount columns. For Fred’s purposes, and those of the typical spreadsheet user, it’s completely fine to have these order number, date, and customer name values duplicated.2 And yes, if Ricky Ponting had in fact purchased three books, then we would once again copy the order number, date, and customer name into row 7 for the third book.
So, as a result, each row represents a line item within an order, not an order itself. And it becomes trivial for Fred to calculate his total sales (SUM column E) and to see how many of each book was sold (Pivot Table using the counts of column D). The table directly above is now considered tidy.
Pivot Tables
A lot of the confusion around storing data tidily comes from Pivot Tables, which are aggregations or summaries of raw data. In Pivot Tables (or any sort of summarised table), there can be column headings and row headings, and then data points in the middle. In the following Pivot Table example, we are looking at how many of each book was sold on each day (I added some more orders).
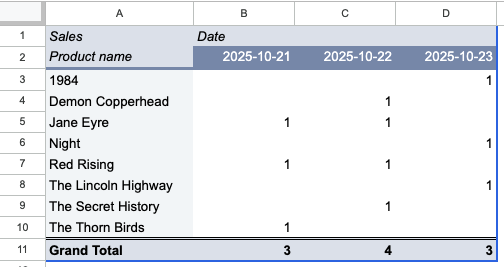
Since Pivot Tables are often used in reports and other published communications, people get the idea that the data is stored like that. Or more specifically, people aren’t really thinking about data storage at all, and just tend to copy whatever they see. But a Pivot Table — as anyone who’s made one can tell you — has to come from a source table of raw data, which is what we’ve been working on in this article. The entire point of structuring the raw data properly in the first place is to be able to easily create such Pivot Tables and get quick insight into your data.3 We could just as easily have summed up sales revenue per book to see our bestsellers.
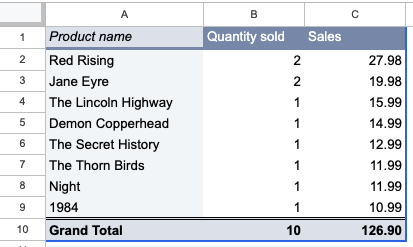
Big wins for authors Pierce Brown and Charlotte Brontë.
Exceptions
Of course, there are no hard rules when it comes to data; there’s just better and worse. And the context of what you’re trying to do is always important in making decisions. There are times where having multiple columns for list-like data makes sense, for example when you’re storing contacts and want to keep a mobile number and business number. Since it’s a small and fixed list, they can be treated just like regular columns. You probably shouldn’t start duplicating your contact rows just to have a single phone number column. It’s only when the list is open-ended that problems start to arise.
Practical application
Keeping your data tidy is a commitment from the very first cell. Think about what an "event" means in your business, and what kind of questions you want to be able to ask of your data. It helps to think of a name for your table, like we did above with orders and order line items. Consider if your data might contain any list-like values, and if so, determine if it's a small, fixed list that you can handle with a few extra columns, or an open-ended one that requires the kind of restructuring we did for Fred and Lighthouse Books.
Tidy data unlocks the ability to use functions and Pivot Tables to get quick answers from your data, and if you don't want that, then why is your data in a spreadsheet to begin with?
Further reading
If you’ve received data in “pivoted” format, i.e., not tidy, and want to tidy it up to make for easier storage and analysis, Ben L. Collins has a great tutorial. I’ve learned a lot from Ben’s articles over the years.
-
Those dates are in the YYYY-MM-DD format, also known as ISO 8601, which is a useful format for preventing month/day confusions that arise in the more common MM/DD/YYYY and DD/MM/YYYY formats. You can find this in the “Custom date and time” section of the Google Sheets format menu. ↩
-
If having duplicated data seems counterintuitive, your mind is on the right track, and that track will lead you to learn about normalisation and third normal form, both of which are beyond the scope of this article (but are extremely interesting for the data-inclined). ↩
-
That's where the name "Pivot Tables" comes from: you are pivoting the raw data's rows, columns, and values, resulting in the summarised table. ↩